
ARTICLE SUMMARY:
A comprehensive analysis of US spending on healthcare by condition aims to provide a more accurate assessment of US spending per disease, with potential to inform policy, industry, insurers, and other stakeholders. Excerpted from our recent MTS feature, Type 2 Diabetes, Dental, MSK Top US Healthcare Spending.
The US spends more than $4 trillion a year on healthcare. Thanks to ground-breaking research at The Dartmouth Atlas of Health Care, we have important, granular data on variations in cost and quality of US healthcare by region. We also have data on hospital admissions, hospital visits, and specific services.
But until recently, we have not comprehensively and methodically analyzed spending per health condition. A research group at the University of Washington (UWA) has for the first time been tracking health expenditures by condition, based on analysis of insurance claims and hospital administrative/encounter-level data extracted from seven sources, with implications for policy makers, insurers, providers, and vendors. Its findings are the most accurate and granular we have to date, says Joseph Dieleman, PhD, of the Institute for Health Metrics and Evaluation at the UWA, and lead author of a paper on US healthcare spending by condition and county, published in the Journal of the American Medical Association (JAMA) on February 14.
Patient advocacy groups and other stakeholders estimate spending on diseases of interest to their constituencies, but those figures often are inflated by extraneous factors, for example, including fixed costs for administrative services that, in reality, are shared among many types of care, he notes.
Having reliable data on spending by condition is useful for understanding the demand for healthcare, the drivers of spending increases, and for assessing spending effectiveness and value, that is, connecting expenditures to outcomes, Dieleman says. Spending on treatment for certain cancers is among the fastest growing categories, but in terms of value, we know that some of the greatest improvements in patient outcomes have been in cancer, he points out.
The JAMA paper details the painstaking considerations the researchers made, how they adjusted their models to address variables, and the data sources they used. Spending on durable and nondurable medical equipment (including over-the-counter drugs and commodity products like bandages) was not included in the studies—nor was spending by the Indian Health Services and Department of Veterans Affairs.
The researchers tracked 148 separate diseases, defined by ICD (International Classification of Diseases) codes, each of which was assigned to one of 24 aggregated health conditions. The analysis captured 76.6% of personal healthcare expenditures covering 97.3% of the US population between 2010 and 2019—the latest available data at the time of the study—stopping just before the COVID-19 pandemic hit. It took four years to complete, creating a lag between the data sets and final publication, a shortcoming the researchers expect to address going forward, now that they have more experience. The next update, incorporating spending through 2022, will be more granular and is expected by year-end 2025, Dieleman says. It will also capture spending during the pandemic and therefore will likely deviate from normalized trends, he adds.
Type 2 Diabetes Is the Biggest US Health Expenditure
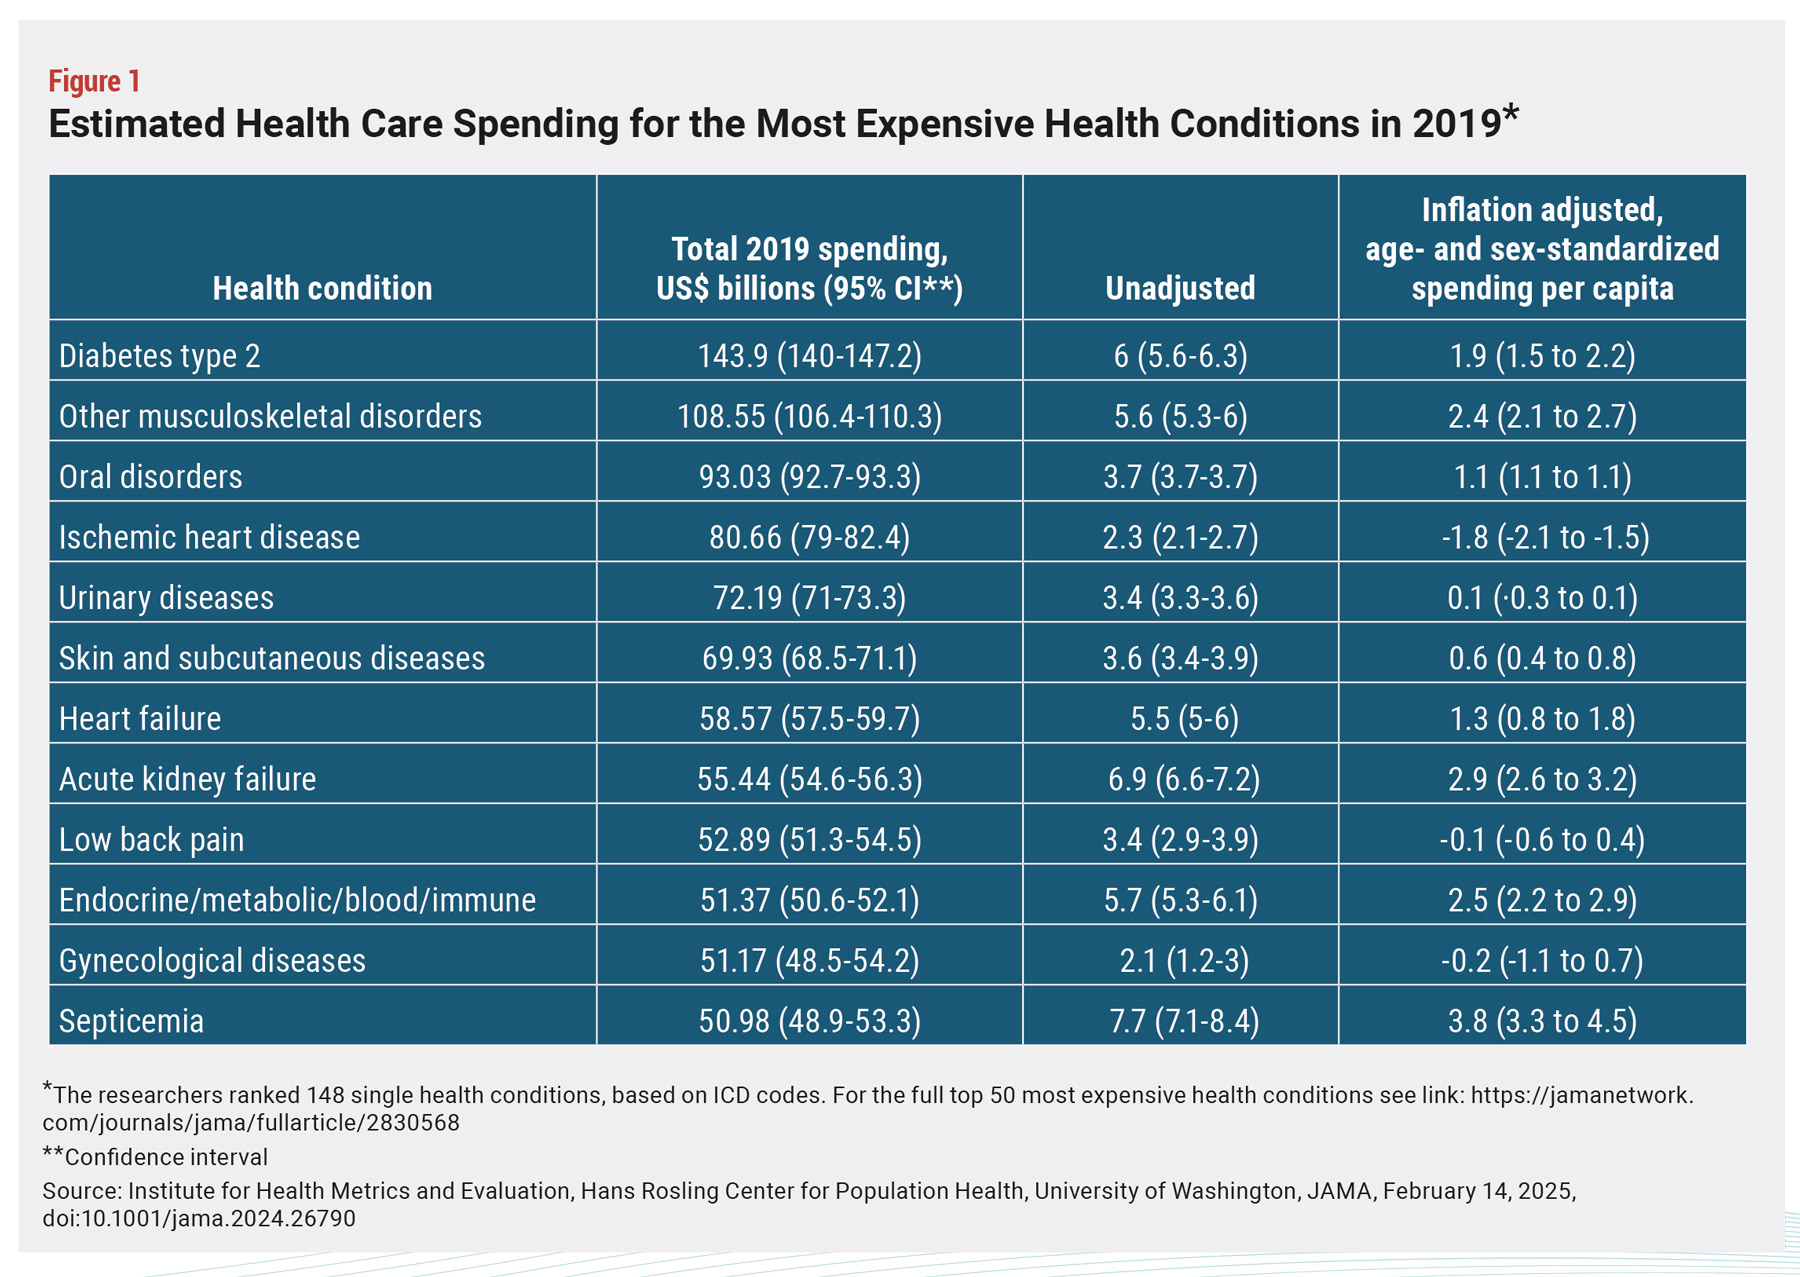 The current study found that the single health condition with the most spending in 2019 was type 2 diabetes ($143.9 billion). This was followed by “other MSK disorders” (joint pain, sports medicine but not including low back pain or neck pain, which each were their own categories: $108.6 billion), oral disorders (dental cavities and orthodontics: $93 billion), and ischemic heart disease ($80.7 billion) (see Figure 1). The cancer with the highest spend, breast cancer, was 18th on the list, with $44.6 billion spent in 2019, growing at inflation-adjusted 1.6%.
In aggregate, the categories shifted. Cardiovascular diseases (13 subcategories, including ischemic heart disease) topped the list ($265.4 billion), followed by neoplasms—which captures data from more than 20 cancers, as well as noncancerous conditions ($258.8 billion)—and MSK (six subcategories: $245.3 billion).
The researchers were also able to track aggregated spending by age, location of treatment, and coverage policy. Of spending on type 2 diabetes, for example, 57.7% was for adults older than 65 years, 34.5% was on ambulatory care, and 31.2% was on prescription drugs. Medicare contributed 39.6% of reimbursement. They also found high variability in spending levels across US counties, with a nearly three-fold difference between low-spending regions (Clark County, Idaho, and Loving County, Texas, and top-spending counties like the District of Columbia, and Nassau and Suffolk counties in New York State). The authors noted that “Variation in healthcare spending across states, even after adjusting for age and payor mix, offers a rich data set for identifying best practices and areas for improvement.”
Continue reading here.